Historical weather forecasts on selected Patagonia summits
A year ago, a friend wrote: "Here are the addresses of the pages to be monitored, they are all the same in structure:
- http://www.mountain-forecast.com/peaks/Monte-San-Valentin/forecasts/4058
- http://www.mountain-forecast.com/peaks/Monte-Burney/forecasts/1758
- http://www.mountain-forecast.com/peaks/Lautaro/forecasts/3380
- http://www.mountain-forecast.com/peaks/Monte-Darwin/forecasts/2488
- http://www.mountain-forecast.com/peaks/San-Lorenzo-Patagonia/forecasts/3706
- http://www.mountain-forecast.com/peaks/Cerro-Arenales/forecasts/3437
The average temperature is like the average temperature in a hospital. You need two separate graphs - the maximum per price and the minimum per day. + maximum wind speed + wind chill
And here's what came out of it.
Monte Burney
Make the charts below interactive
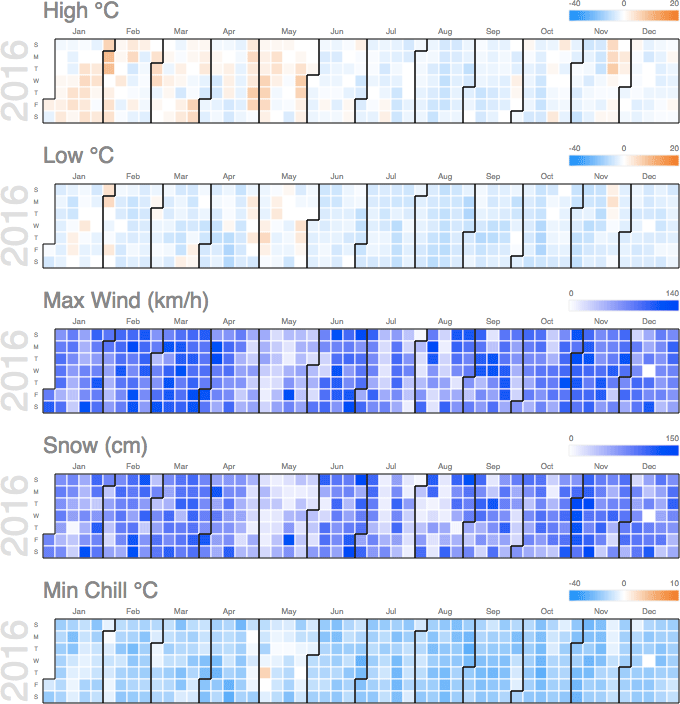
Monte Darwin
Make the charts below interactive
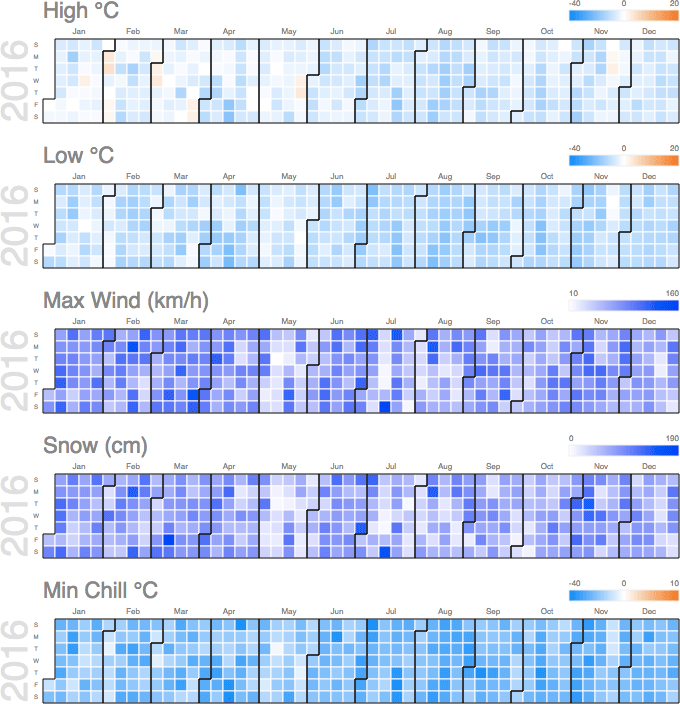
Lautaro
Make the charts below interactive
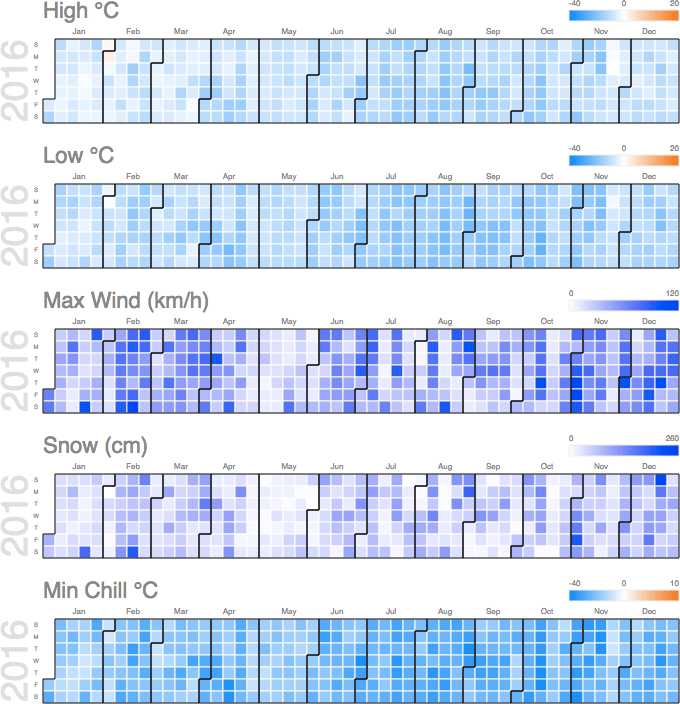
Cerro Arenales
Make the charts below interactive
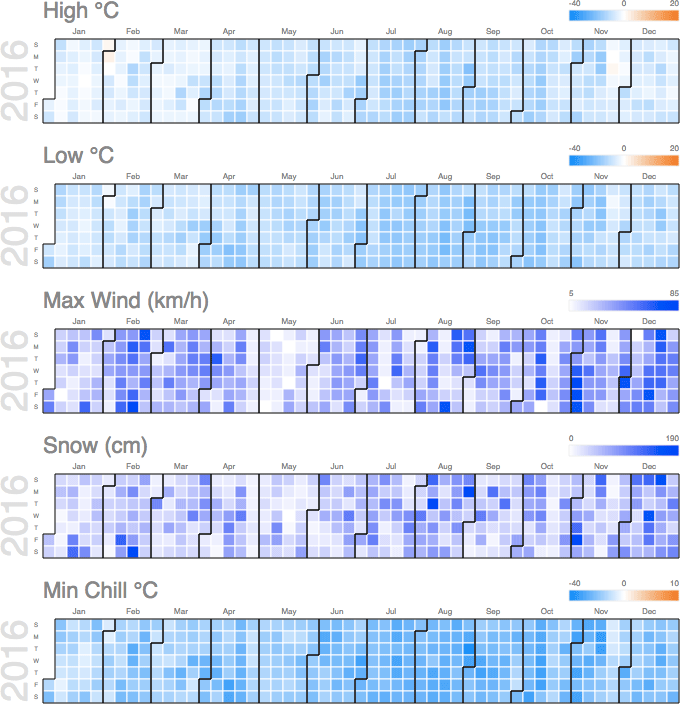
San Lorenzo Patagonia
Make the charts below interactive
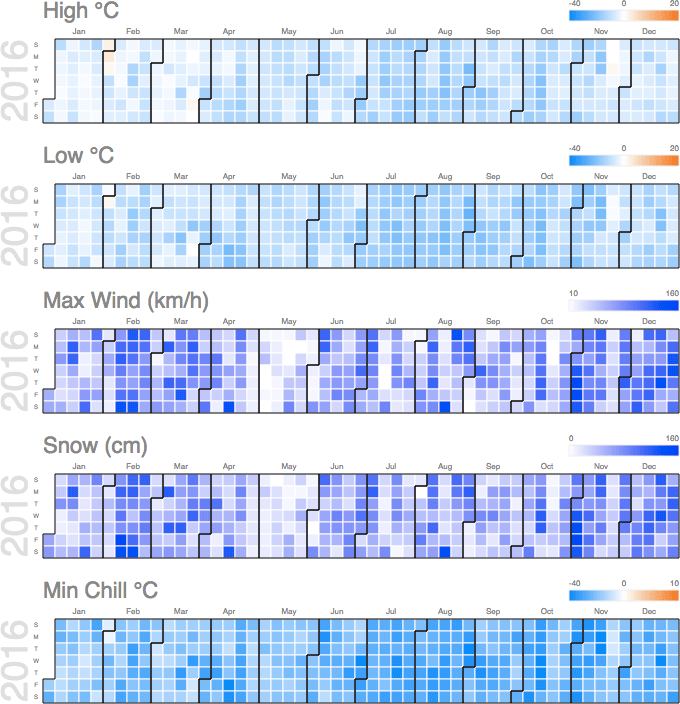
Monte San Valentin
Make the charts below interactive
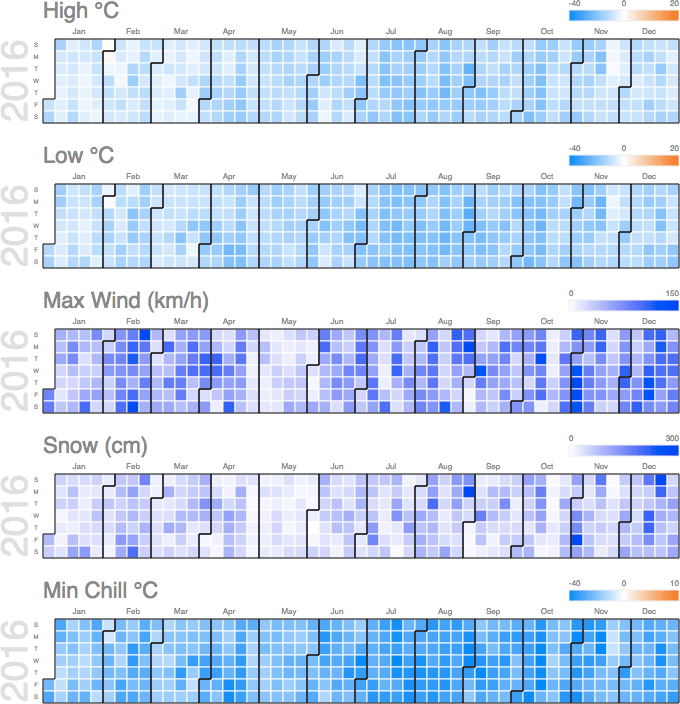
List of peaks in Chile (wikipedia.org)
Sources: https://bitbucket.org/raskumandrin/mountain-forecast/src
